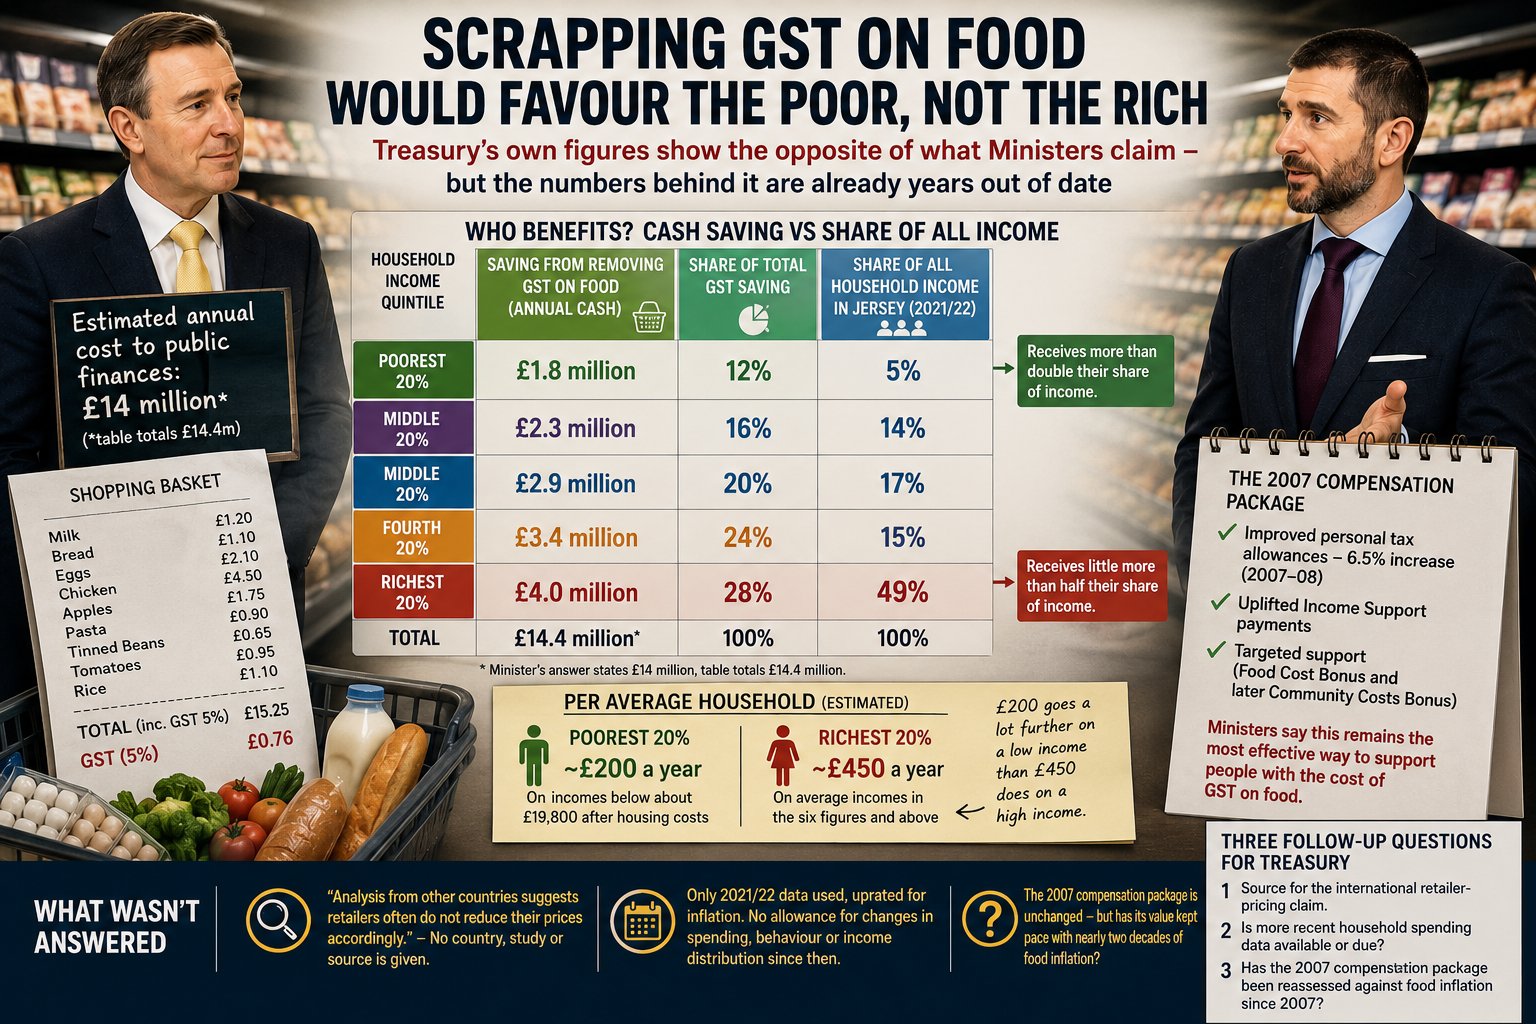
Treasury's own figures show scrapping GST on food WOULD favour the POOR, not the RICH — but the numbers behind it are already years out of date
Removing GST from food would return proportionally more to Jersey's lowest-income households than their existing share of the island's income would suggest — even though, in raw cash terms, wealthier households would save more. That is the finding buried in a written answer from the Minister for Treasury and Resources this month, and it cuts against the government's own framing of the policy. The figures came in response to a written question from Deputy Lee Carpenter, who asked for an estimate of the annual cost of removing GST from "food and essential grocery items," and for an assessment of how the change would affect lower, middle and higher-income households. The headline cost, in the Minister's answer published 13 July, is £14 million a year — though the table beneath it totals £14.4 million, a small gap the government's own document doesn't reconcile.
"cash isn't the only measure"
Who actually benefits
Broken down by income quintile — Treasury's method of splitting all Jersey households into five equal-sized groups, ranked from the poorest 20% to the richest 20%, to see how a policy lands across the income scale rather than as a single national average — the poorest fifth of households would save £1.8 million a year, or 12% of the total saving. The richest fifth would save £4.0 million, or 28%. Read on its own, that looks regressive, and the Minister's answer frames it that way: "removing GST from food provides the most benefit to the highest income households because they spend most on food." That's true in cash terms — wealthier households simply spend more pounds on food overall, even though it's a smaller share of their budget. But cash isn't the only measure, and set against Jersey's actual income distribution the picture flips. Statistics Jersey's separate Household Income Distribution report — covering the same 2021/22 period — shows the poorest 20% of households receive just 5% of all household income in Jersey, while the richest 20% receive 49%. Compared with those shares, the GST saving is skewed toward the bottom, not the top: Poorest quintile: 5% of all income, but 12% of the GST-on-food saving — more than double their existing share. Richest quintile: 49% of all income, but only 28% of the saving — little more than half their existing share. Relative to where households actually sit in Jersey's economy, removing GST from food is a mildly progressive policy. Per household, it works out to roughly £200 a year for an average household in the bottom quintile (on incomes below about £19,800 after housing costs) against roughly £450 a year for an average household in the top quintile, whose income has no upper bound and average income there runs far higher. £200 goes a lot further against a sub-£20,000 income than £450 does against six figures. That doesn't mean the case for removing GST on food is closed — Ministers still have a counter-argument, but it isn't "the rich benefit more."
"The estimate rests on Statistics Jersey's Household Spending Survey, fieldwork for which ran from October 2021 to November 2022 — a period covering the tail of pandemic-distorted spending and the start of the cost-of-living surge."
The 2007 compensation package
The Minister's stated preference is to leave GST on food in place and rely on the mechanisms introduced when GST was first brought in: a 6.5% increase in personal tax allowances (2007–08), uplifted Income Support payments, and targeted schemes like the Food Cost Bonus and its successor, the Community Costs Bonus. The answer treats this package as "the most effective way to support people with the cost of GST on food" — but doesn't show whether it has kept pace with food costs since 2007. That's the real test of the government's position, and it's answerable: has that compensation been uprated in line with food inflation, or has its real value eroded over nearly two decades?
What wasn't answered
Carpenter's question covered "food and essential grocery items." Treasury only modelled food, saying "essential grocery items" is undefined and so nothing could be included. That's a fair practical point — Jersey's flat-rate GST has no category structure to isolate items like nappies, sanitary products or cleaning supplies the way UK VAT does — but it also means half the question went unanswered, with no attempt even at a rough estimate. The answer also states that "analysis from other countries suggests retailers often do not reduce their prices accordingly" when GST or VAT is cut on food — with no country, study or source given. It's doing real work in the argument against the policy and is currently unverifiable.
How current is £14.4 million, really
The estimate rests on Statistics Jersey's Household Spending Survey, fieldwork for which ran from October 2021 to November 2022 — a period covering the tail of pandemic-distorted spending and the start of the cost-of-living surge. Treasury uprated that survey data using the RPI food index from Q1 2022 to Q1 2026 to bring it to current prices, which adjusts for food price inflation (running at 3.7% over the year to March 2026, faster than the 2.7% headline rate) but not for anything else — not households switching to cheaper alternatives, not changes in how much people buy, not shifts in the income distribution since 2022. Statistics Jersey runs this survey roughly every five years, so there's no newer dataset to check it against. None of that makes £14.4 million wrong. It means it's a modelled projection on ageing data, presented with a precision — split five ways by quintile, to the hundred thousand pounds — the underlying data may not fully support.
The follow-up questions
Three are worth putting to Treasury directly: the source for the international retailer-pricing claim; whether more recent household spending data exists or is due; and whether the 2007 compensation package has been reassessed against nearly two decades of food inflation, given it remains the government's stated reason for leaving GST on food as it is.
Sources
- States Assembly – WQ.142/2026, "Removal of GST from food and essential grocery items" (web version)
- States Assembly – WQ.142/2026 official PDF
- Statistics Jersey – Household Spending 2021/2022 report published (gov.je news item)
- Statistics Jersey – Household spending statistic page
- Statistics Jersey – March 2026 Retail Prices Index published
- Statistics Jersey – Retail Prices Index March 2026 (publication)
- Statistics Jersey – Households and dwellings: Census 2021 (44,583 households figure)
- Statistics Jersey – Jersey Household Income Distribution 2021/2022 report (quintile income shares, quintile boundaries)
Discussion (0)
Log in to join the discussion
No comments yet. Be the first to discuss this article!